Published February 6, 2023
A Comprehensive Guide to Data Analytics
Get a complete understanding of data analytics with this comprehensive guide. Explore the various techniques, tools, and processes for analysing and interpreting data to make informed decisions. Enhance your skills and stay ahead in the field of data analytics.

What is data analytics?
Data analytics is the process of examining and transforming data, with the aim of deriving insights and meaningful information from it.
The examination and transformation process can be compared to a puzzle.
Just as putting together a puzzle requires sorting through pieces, analysing their shapes, and fitting them together to form a complete picture, data analytics involves sorting through large datasets, examining the relationships between variables, and piecing together the information.
“To know thyself is the beginning of wisdom”
By extension, business analytics refers to the use of data and statistical methods to support decision-making in an organisation. Business analytics is used in various business functions, including finance, marketing, and operations. The goal of business analytics is to form a complete understanding of all the interwoven subsectors of a business, extrapolate out the turning of every individual cog, and synthesise it all back into actionable insights. These insights are then executed upon by the leadership team, and the results are measured.
By replacing subjectivity with objectivity, intuition with metrics, and guesswork with insight, we eventually replace good decisions with better decisions.
The process of utilising data analytics is a continual, ever-evolving journey. The journey can involve taking a thin vertical slice of a business and building something end-to-end that delivers value, or even just laying the foundations for continual iterative advancements. Advancement often involves cleaning and transforming the data, similar to sorting puzzle pieces by colour and size, and using statistical methods and visualisation tools to identify patterns and relationships.
The difference is instead of ending up with a picture of a sailboat, putting the puzzle pieces together for analytical patterns and relationships will leave you with a multi-million dollar company.
Types of analytics
With the increase in popularity of big data analytics, there is an ever-growing number of analytics applications. Each of these applications of analytics fall under the following main categories:
- Descriptive Analytics: Provides a simple and straightforward overview of what has happened in the past. Descriptive analytics tools are used to summarise data and present it in an easily understandable format, such as charts and graphs.
- Diagnostic Analytics: Used to find the cause of a specific problem or issue. It involves drilling down into the data to identify patterns, correlations, and root causes.
- Predictive Analytics: Used to forecast future trends and behaviour based on historical data. Predictive analytics tools can be used to identify trends and patterns in the data and make predictions about future events.
- Prescriptive Analytics: Takes predictive analytics a step further by providing actionable insights and recommendations. Prescriptive analytics tools can be used to generate solutions to problems and to recommend specific actions that organisations should take to optimise their operations.
By understanding the different types of analytics and their capabilities, organisations can select the tools and techniques that are most relevant to their specific needs and goals. Whether it’s identifying trends, optimising operations, or forecasting future trends, analytics has the power to provide organisations with the insights they need to succeed.
Why is analytics important?
By leveraging the power of data and analytics, businesses can gain valuable insights and make informed decisions that drive growth, improve operations, and increase profitability. Relying solely on intuition may lead to correct outcomes most of the time, but attaching decisions to an objective metric will help mitigate the fallout in the few times when intuition leads us astray.
There are numerous benefits that arise from transitioning across to the more objective landscape that analytics can provide, including;
- Better Decision Making: Data analytics provides businesses with the ability to make informed decisions based on data rather than intuition or guesswork. This can help businesses avoid costly mistakes and make more effective decisions that drive growth and improve profitability.
- Increased Efficiency: Data analytics can help businesses streamline their operations and identify areas for improvement. This can help businesses reduce costs and increase efficiency, which can ultimately drive growth and improve profitability.
- Better Customer Understanding: Data analytics can help businesses gain a deeper understanding of their customers, including things like buying patterns, customer preferences, and customer behaviour. This can help businesses tailor their marketing and sales efforts to better target their ideal customers and drive sales.
- Improved Operations: Data analytics can help businesses identify areas for improvement in their operations, from supply chain management to customer service. This doesn’t even have to be limited to cost-reduction activities – using predictive analytics to determine expected capacity levels and proactively identifying potential bottlenecks can help scalability of operations.
Over a long enough time horizon, a company that hedges their risk of poor decision making (even incrementally) by relying on objective truth over subject intuition, will win.
Data Warehousing and Management Tools
Data warehousing and management tools provide a centralised repository for storing and managing large and complex data sets, enabling data analysts to easily access, manipulate and analyse the data. These tools are designed to handle the high volume, velocity and variety of data that is typically generated by modern organisations, making them ideal for big data analytics.
Data warehousing and management tools also provide powerful data management capabilities, such as data governance, data security, data integration and data quality, which are essential for ensuring the reliability and accuracy of the data. Safeguarding reliability helps ensure that the data being analysed is complete, consistent, and accurate, which is critical for accurate and meaningful results.
In addition, data warehousing and management tools often provide advanced features such as data warehousing, data mining, and OLAP (Online Analytical Processing), which can be used to perform complex data analysis and uncover hidden patterns and relationships within the data. These advanced features allow data analysts to explore, analyse and make sense of the data in new and innovative ways, enabling them to uncover valuable insights and information from the data.
The most commonly used data warehousing tools include;
- SQL
- Teradata
- Amazon Redshift
- Google BigQuery
- Snowflake
- Microsoft Azure Synapse Analytics
- Apache Hadoop
- Apache Spark
- Greenplum
- Exasol
Programming Languages and Statistical Software
Programming languages and statistical software provide a comprehensive set of tools and techniques for processing, analysing and making sense of large and complex data sets. These tools enable data analysts to perform a range of data transformation tasks, such as cleaning and transforming data, and manipulating it into the appropriate format for analysis. These transformation tasks help ensure the quality and reliability of the data, which is critical for accurate and meaningful results.
Once the data is properly transformed, programming languages and statistical software can be used to perform various statistical and machine learning techniques. These statistical techniques help to uncover valuable insights from the data. The insights can be derived from simple descriptive statistics, such as calculating means and standard deviations, to more complex methods, such as regression analysis and clustering.
The most commonly used programming languages and statistical software tools include;
- R
- Python
- SAS
- Julia
- MATLAB
- Stata
- SPSS
- Octave
- Wolfram Mathematica
- Scala
Data Visualisation Tools
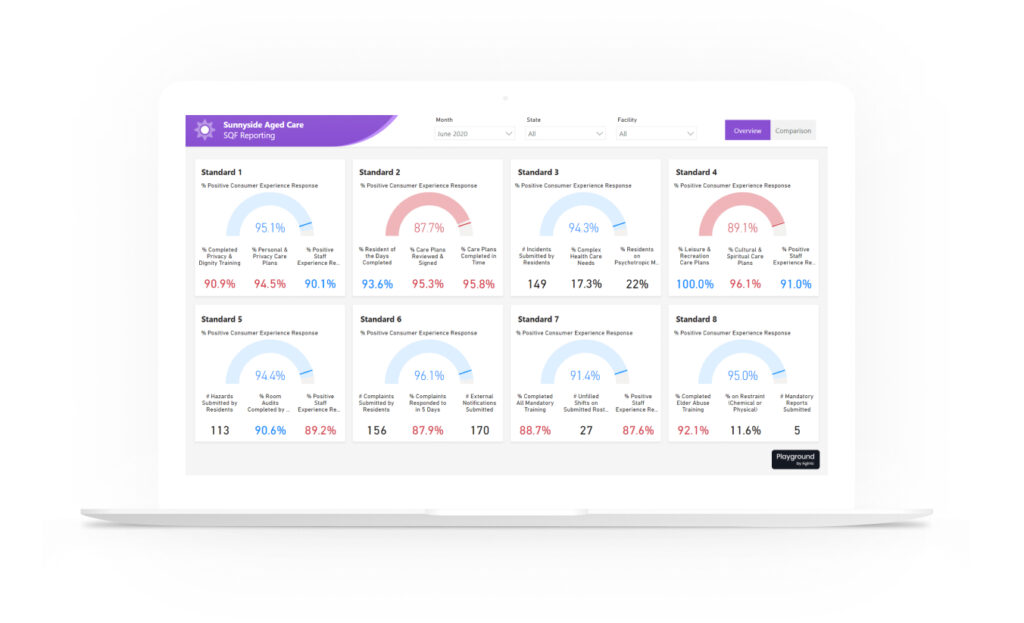
Data visualisation tools play a key role in data analytics by providing an effective way to present and communicate the results of data analysis. They allow data analysts to create meaningful, intuitive and interactive visual representations of data that can help people understand and make sense of the information contained within. By visualising data in this way, data analysts can highlight patterns, relationships and trends in the data that would be difficult to detect through other means.
Data visualisation tools are versatile, allowing for the creation of a wide range of visualisations, from simple bar charts and line graphs, to more complex visualisations such as heat maps, tree maps, and network diagrams. They also often provide interactive features, such as drill-down, filtering, and highlighting, that enable data analysts to explore the data in depth and make meaningful comparisons.
Another important aspect of data visualisation tools is their ability to communicate data effectively to a wide audience. This is particularly important in organisations where data-driven decisions are made by people with varying levels of technical expertise. Data visualisation tools help bridge the gap between technical and non-technical stakeholders by presenting complex data in an intuitive and easy-to-understand manner.
- Tableau
- PowerBI
- Google Analytics
- RapidMiner
- KNIME
- IBM Cognos Analytics
- QlikView
- TIBCO Spotfire
- MicroStrategy
- Oracle Business Intelligence
- Microsoft Excel
- D3.js
- Gephi
- Grafana
- Looker
Careers in data analytics
A career in data analytics typically requires a combination of technical and soft skills, including strong analytical skills, technical proficiency, effective communication, attention to detail, and creativity. The ability to collect, process, and make sense of large amounts of data is essential, as well as proficiency with programming languages such as Python or R and experience with data visualisation tools and databases. The ability to translate complex data insights into actionable recommendations for non-technical stakeholders is also key.
Common data analytics careers include;
- Data Analyst: Analyses and interprets complex data sets to inform business decisions and drive progress.
- Business Intelligence Analyst: Develops and implements data-driven solutions to support decision making and strategic planning.
- Data Scientist: Combines statistical analysis, machine learning, and domain expertise to extract insights and solve complex problems.
- Machine Learning Engineer: Builds and implements machine learning models to analyse and interpret data.
- Big Data Engineer: Designs and develops large scale data processing systems and infrastructure to support data analytics initiatives.
- Database Administrator: Maintains and manages an organisation’s databases to ensure data integrity, security, and availability.
- Data Engineer: Builds and maintains the infrastructure for data storage, processing, and retrieval.
- BI Developer: Develops and implements business intelligence tools and solutions to support data-driven decision making.
- Predictive Modeller: Develops statistical models to predict future outcomes based on historical data.
- Data Architecture: Designs and implements data structures, data systems, and processes to support data analytics and information management.
Careers in data analytics typically support a good work-life balance, and are compensated well. Graduates with a analytics-related degree in Australia can expect to earn between $60,000 and $75,000 their first year, while experienced Australian analysts earn between $80,000 and $115,000.
If you would like to explore how analytics fits into your universe, feel free to reach out.