Who we work with
https://www.youtube.com/watch?v=fiKHHSUWUss
Changing how the world
works for the better.
Australia & New Zealand’s trusted partner in Cloud, Data, Digital & Security


Explore our services
Cloud
We partner with you to build, run and scale your cloud. Identify, plan and deploy cloud technologies rapidly and securely.
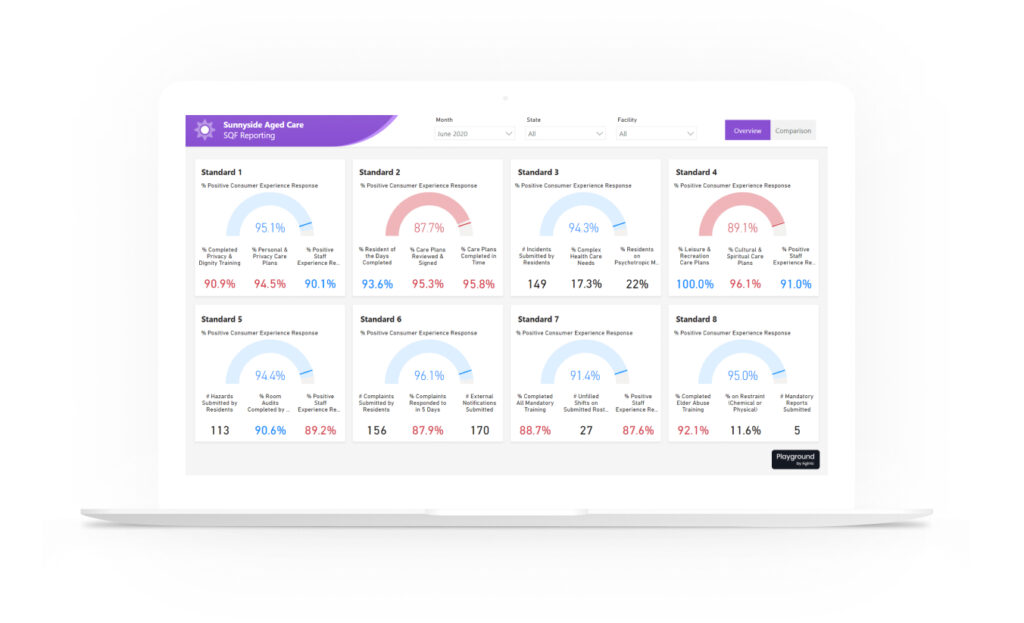
Data
No matter where you are in your data journey, we’re here to help. We transform complex data sets into meaningful insights.
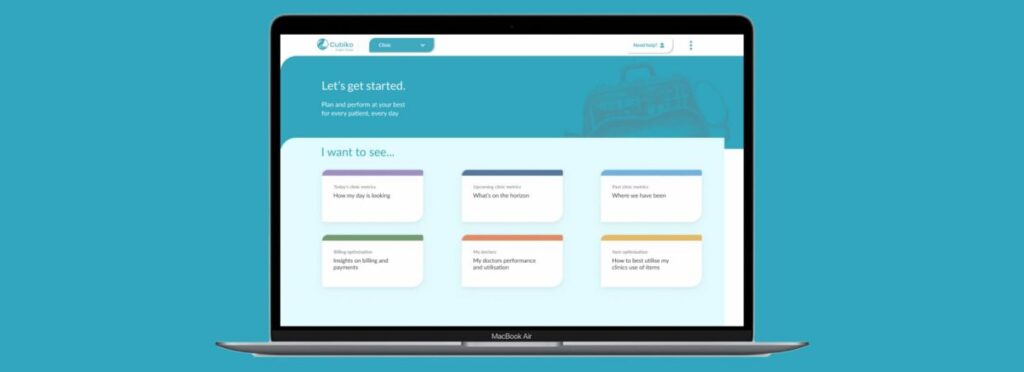
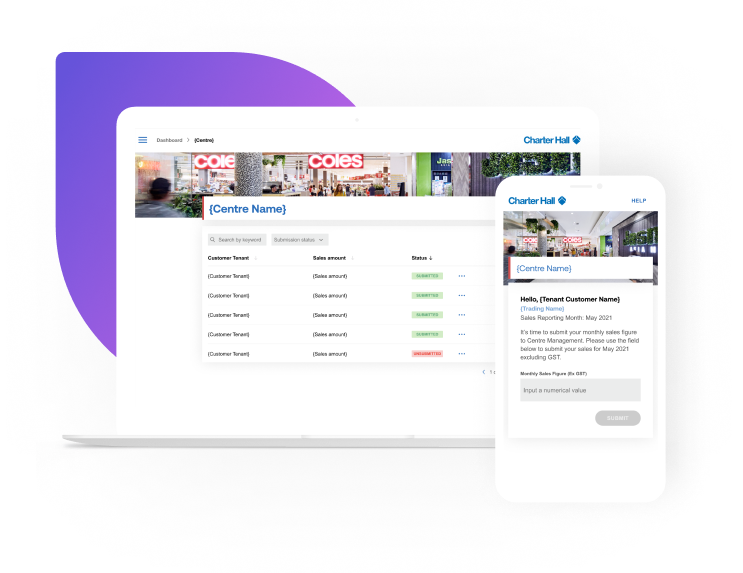
Digital
Our human-centred approach to design, engineering and advisory delivers exceptional customer experiences.
Security
Our advisory, infrastructure and implementation services transform security into resilience and for your organisation.

The Mantel Group way.
Dynamic. Pragmatic.
Holistic understanding
Our expertise spans Cloud, Data, Digital and Security and we’re ready to solve challenges in many shapes and forms.
Top talent ANZ
We create, attract and retain the best and brightest talent in the industry. This enables us to always assemble the best team to meet your specific needs.
Deep specialisation
We are specialists, deep technology experts and thought leaders. We take great pride in our work and are committed to inspiring your confidence in us.
We get it done
We take a pragmatic approach and pride ourselves in our non-bureaucratic nature to deliver outcomes quickly and reliably, so you can focus on what matters.
Alignment
We’re a natural extension of your team. We bring fresh perspectives, energy and expertise, allowing us to work as one.
Results driven
With a focus on value, Mantel Group works with your budget to bring best-of-breed solutions for your problems.
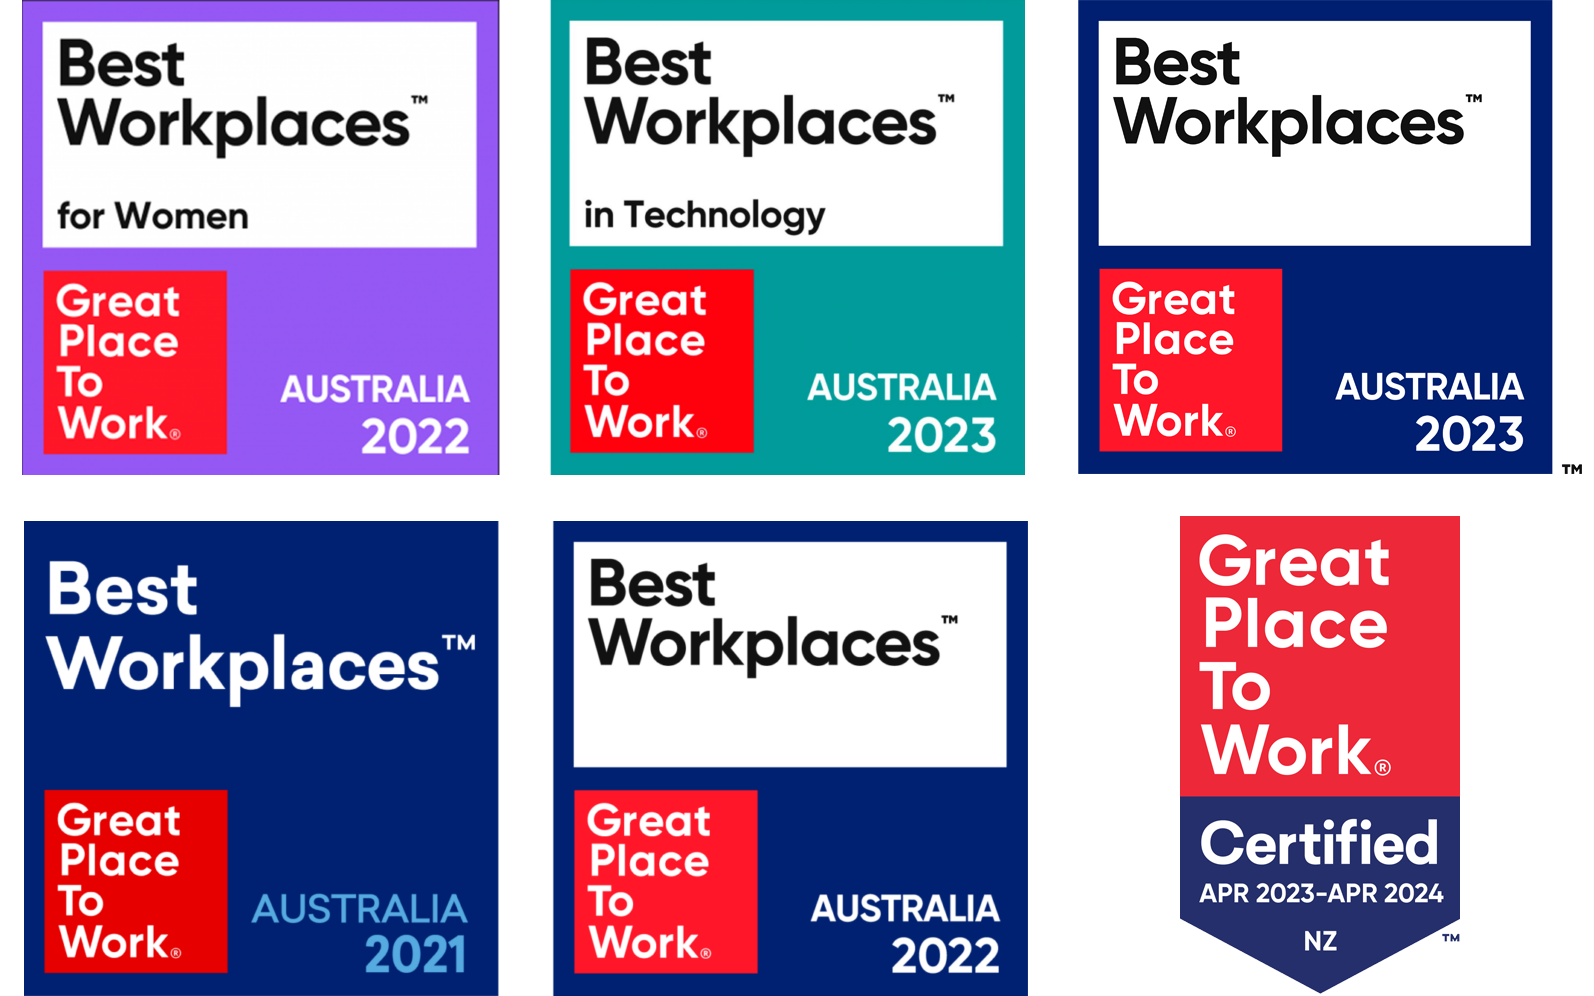
The best for
a reason
Connect with us and find your new home
Partnerships
We work with the best technology partners to deliver exceptional results for your business.